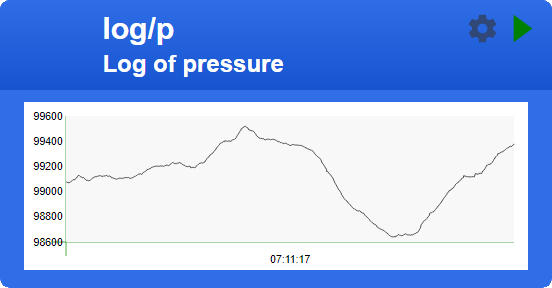
Line Microchart
The Line Microchart displays a series of values using a line on a x/y area with optional axis and reference lines.
It is a pure JavaScript based implementation that uses SVG to display the graph and axis.
The JSON object passed as parameter defines the options for the chart and includes the data of the line chart.

Global Options
The Line Chart requires not to set the global options.
Add Elements
The Line Chart needs to be created by adding the individual elements:
- The line element is required to display the line corresponding to the data.
- The hline element can display a horizontal reference line.
- The vAxis element specified the vertical axis format.
- The hAxis element specified the horizontal axis format.
- The indicator elements specifies how data values are shown on mouse hover.
Draw the data
The data of the line chart must be an array of points with a x and y value;
  var data = [
    { x: 0, y: 2 },
    { x: 1, y: 3 },
    { x: 2, y: 6 },
    { x: 3, y: 5 },
    { x: 4, y: 7 }];
By adding a line element the id of the line is returned this id can be used to draw data using the line element.
  var lineID = chartAPI.add('line', { linetype: 'line', color:'green' });
   chartAPI.draw(lineID, data);
When adding the line element the following options may be used:
- linetype - The linetype controls how the line is drawn. Options are “line” and “steps”,
- color - the color of the line can be defines; defaults to “black”.
Add X-Axis
chartAPI.add('HAxis', options);The following options may be used:
- format - The data format of the x-axis. See Data Formats below.
- color - the color of the x-axis text; defaults to “black”.
Add Y-Axis
chartAPI.add('VAxis', options);Add horizontal line
By adding a horizontal line the y-range will probably be extended to include the line value.
chartAPI.add('hline', options);- data - the y-value for the line. Defaults to 0.
- color - : The color of te line.
- marker - : The data points are market with small dots on the line.
Add Indicator
chartAPI.add('indicator', options);- xFormat - format of the x value. See Data Formats below.
- yFormat - format of the y value.
has no additional elements to be added. The add() method is available but without any effect.
Data Formats
The values on given points may be presented using the following formatting options:
- date - The data is formatted as a date.
- time - The data is formatted as a time.
- datetime - The data is formatted as a date + time.
- num - The data is formatted as a number with an optional precision. e.g. ‘num:2’.
SVG implementation remarks
linechart.svg linechart.js
https://atomizedobjects.com/blog/javascript/how-to-create-svg-bar-chart-javascript/
+-----------------------------------------------------------------------+
| (padding at top: height= 4)                                           |
+-----------+-------------------------------------------------------+---+
| (v-labels)|  (panel)                                              |(4)|
| width=12  |  width=128                                            |   |
| height=36 |  height=36                                            |   |
|           |                                                       |   |
|           |                                                       |   |
|           |                                                       |   |
|           |                                                       |   |
+-----------+-------------------------------------------------------+---+
|           | (h-labels)                                            |   |
|           | width=128, height=8                                   |   |
+-----------+-------------------------------------------------------+---+

All regions start 0/0 in the left lower edge, x-offset going right, y-offset going up

TODO: Add another vertical axis.
 when adding another vertical axis the total width will be extended by another 12 units.

TODO: horizontal axis as timeline
(up to 4 labels with line) first day + days/4, day, 12 hours, 6 hours

delta > 4 days : days+ days/4
delta < 4 days : full days
delta < 2 days : full 12 h
delta < 1 days : full 6 h

TODO: horizontal axis numbers (milliseconds)
ranges analog vertical axis implementation.